Wednesday, March 26, 2014
Monday, March 24, 2014
Blog #8
03/19/2014 Wednesday
Activ Physics: 11.4 Electric Field Point Charge (answers)
Electric field hockey simulation:
Level 1: Have the black puck as positive, set one red puck next to the black puck at the upper left corner of it and set another red puck down. Run simulation. It should repel the black pucks into the goal.
Level 2: Same setup from level 1 in order to go around the walls blocking. Place the red puck at the bottom of the field slightly more to the right.
Level 3: Have the black puck set to positive. Place a red puck down the initial position of the black puck. Have a blue puck place at top of the field next to the second wall. Have a 2nd blue puck at the other side of the second wall parallel to the 1st blue puck. The black puck should be repelled by the red and attract by the two blue puck and into the goal.
Excel assignment of prediction electrical fields
Wednesday, March 19, 2014
Blog #7
03/17/2014 Monday
By ripping off two piece of tape together, we can electrically charge each piece.
Swing example with electric force
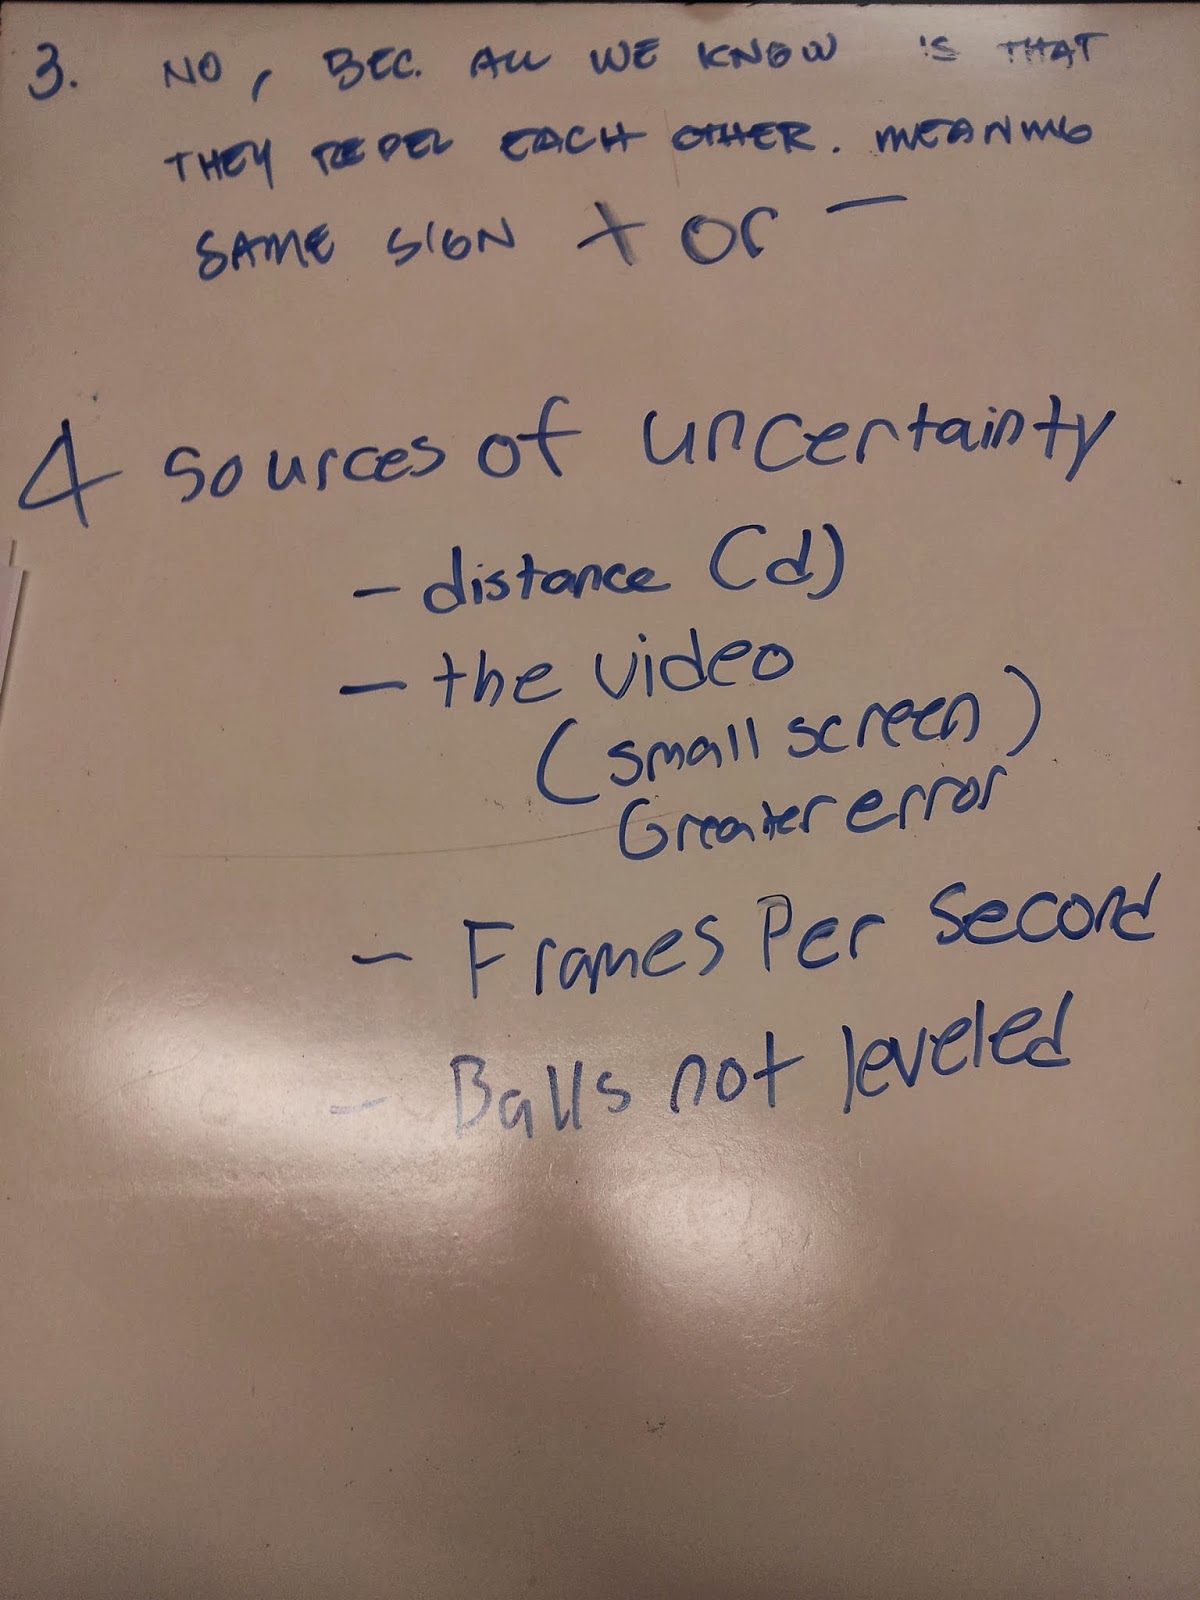
Like charge repulsion experiment
A graph of the repulsion force vector in relation to distance between the two charged objects.
Since there are errors in the supplied data, we can still predict that the result is still inversely proportional. there is a 17% difference between the theoretical and experimental.
Activphysics answers
Monday, March 17, 2014
Blog #6
3/12/2014 Wednesday
Worksheet for diesel cycle. Efficiency should be within 60-70%. We came up with an efficiency of about 62% making our answers correct.
Wednesday, March 12, 2014
Blog #5
3/10/2014 Monday
An experiment involving steam, which direction will the flask rotate. The flask contains a little water inside and is suspended by a plastic filament. The flask is then heated making the water boil creating steam which then is released out from tubes pointing parallel to the ground. The flask did rotate at a counter clockwise direction. (caution: the filament may melt causing the flask to drop)
The Carnot cycle of pressure vs volume graph which involves adiabatic on path B-C and D-A and isothermic on path A-B and C-D. Results are shown on the table bellow.
2nd part of the Carnot cycle. Some key formulas used in order to solve for the work for both adiabatic and isothermic.
An experiment showing the pressure vs volume graph when the flask is moved to hot and cold. The syringe is loaded with a weight causing it to go down. Then its submerged in a hot water bath.
The flask is then moved to an ice water bath.
the syringe scale then moved down.
Activphysics #6
Activphysics #7
Activphysics #8
Monday, March 10, 2014
Blog #4
3/5/2014 Wednesday
Air tight piston experiment. In this experiment, volume was constant inside the container and a small piece of paper was inserted. A force was applied to the piston increasing the pressure inside the container causing the paper to ignite. Since force was applied on the piston, the change in work W was positive. There was a change in heat Q that occurred inside too since there was a spark of ignition. By applying the 1st law of thermodynamics deltaU = Q - W, we can say that there is a positive internal energy that occurred inside the container.
Equation for the air-tight piston experiment.
Graph of isochoric process where in pressure is constant, volume b
Graph of Isothermal Process where in temperature is constant, pressure vs. volume
Graph of isobaric process where in pressure is constant, pressure vs. volume
Prediction before running the simulation.
demonstration of the 1st experiment
Wednesday, March 5, 2014
Blog #3
Blog #3 (3/5/2014)
set up for first experiment pressure vs temperature can experiment. The can is heated up in a hot plate with water inside the can. afterwards, the can is submerged upside down in a container with water.
prediction on pressure vs temperature can experiment
aftermath of can after submerging in the water. it rapidly crushed the can making our prediction true.
second experiment setup, syringe attached on a tube and flask (not shown in picture)
warm water at 34.0 C
room temperature water at 24 C. apparatus submerged in room temp water with 150 cc volume of gas (volume of gas in flask, syringe and tube added in)
apparatus submerged at hot water causing the syringe to go up
apparatus submerged in cold water causing the syringe to go down
result of the second experiment. volume of syringe results are good since it falls with in the uncertainty of syringe at +/-0.05cc and the volume of the flask falls with the uncertainty of the flask which is +/-0.05cc. also the temperature for both hot and cold falls with the uncertainty of +/-0.2C making the results reasonable
set up of the balloon experiment. small amount of air was blown in the balloon.
the pressure inside the container was taken out
machine was turned back on causing the pressure to go back in the container
my group's prediction on the balloon experiment
set up for the marshmallow
pressure was taken out of the container
machine was turned back on causing the pressure to go back in. notice that the marshmallow didn't go back to it's original state. it actually got smaller and formed wrinkles. also, the taste was different too since it lost most of it air (i tried it for myself).
prediction for the marshmallow and balloon experiment
last experiment, hot water was placed inside the cup and syringe was trying to go up but the professor was resisting the rise of the volume causing the internal energy of the gas to rise meaning that the heat of the gas is rising at a much faster rate.
prediction on the last experiment and its relation with work energy theorem.
Subscribe to:
Comments (Atom)


.jpg)


